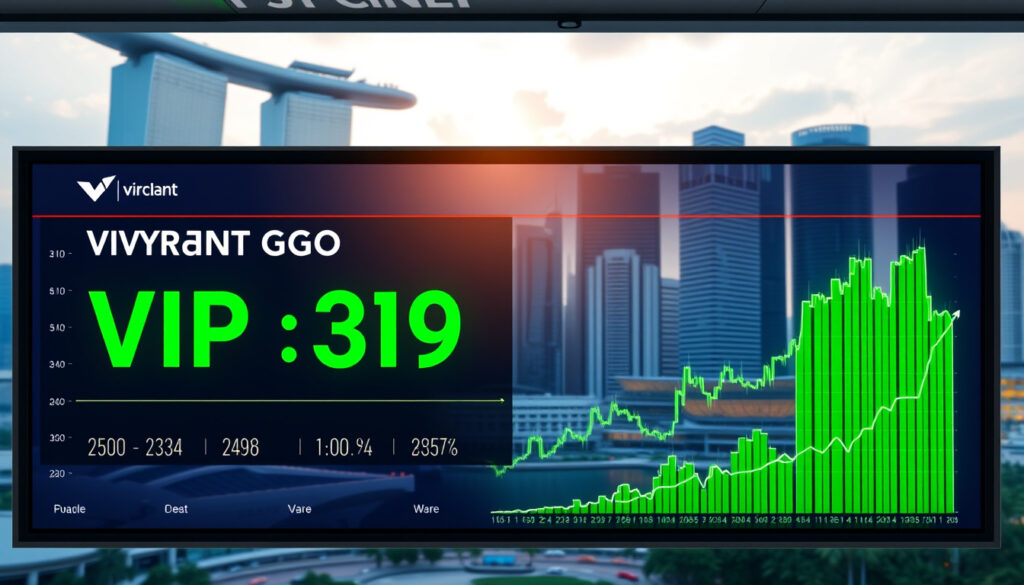
Vibrant Group Share Price: Live SGX:BIP Quote & News
Small-cap Singapore stocks rarely grab headlines, but Vibrant Group (SGX:BIP) has quietly stacked up a 213% price gain over the past year while paying a dividend that now sits around 2.4% yield. For investors watching freight-and-logistics names on the exchange, that’s a combination worth a closer look.
Current Price: 0.138 SGD · Previous Close: 0.142 SGD · Day High: 0.142 SGD · Day Low: 0.14 SGD · 52 Week High: 0.22 SGD
Quick snapshot
- Dividend 0.002 SGD per share paid Sep 6, 2024 (StockAnalysis)
- EPS TTM 0.01 SGD across four data points (StockAnalysis)
- Market cap 54.43M SGD as of May 23, 2025 (StockAnalysis)
- Yield varies 2.41%–4.82% across platforms
- No Tier 1 SGX or company-filing confirmation
- Limited 2025-2026 forward guidance
- Sep 9, 2025 ex-dividend date listed (Fintel)
- 1-year price change 213.73%, beta 0.28 (Fintel)
- Shares 64% above 200-day moving average (Stockopedia)
- Next ex-dividend window Sep 9, 2025 (Fintel)
- P/E 7.2x vs sector 13.4x — lower valuation (Investing.com)
- Analyst price targets not publicly available (Fintel)
| Metric | Value | Source |
|---|---|---|
| Stock Symbol | SGX:BIP | StockAnalysis |
| Current Price | 0.138 SGD | Tiger Brokers |
| Market Cap | 54.43M SGD | StockAnalysis |
| Sector | Transportation / Freight & Logistics | TradingView |
| 52 Week Range | 0.0490 – 0.22 SGD | StockAnalysis |
| P/E Ratio (TTM) | 7.68 | StockAnalysis |
| Shares Outstanding | 680.35M | StockAnalysis |
| Beta | 0.28 | Fintel |
Does Vibrant Group pay dividends?
Yes. Vibrant Group operates an annual dividend policy, with shareholders receiving payouts around September each year. The most recent confirmed payment was 0.002 SGD per share on an ex-dividend date of September 6, 2024, according to StockAnalysis. That represents a doubling from the prior year’s 0.001 SGD dividend paid on September 7, 2023.
Dividend history and yield
Dividend growth has been notable: the per-share payout doubled year-over-year, and trailing yields reported across platforms cluster between 2.41% and 2.9% currently. TradingView reported a 4.82% yield in 2024 with a 35.40% payout ratio, a figure that reflects the stock’s lower price level at that time. The yield has since compressed as the share price climbed roughly 214% over the past year.
The 100% dividend growth signals management commitment to shareholder returns, even at a modest absolute payout. Income-focused investors should weigh the current ~2.4-2.9% yield against alternatives in the Singapore market.
Ex-dividend dates
The next ex-dividend window is projected for September 9, 2025, per Fintel data. Investors holding shares before that date would qualify for the upcoming annual payout. The historical pattern of September ex-dates has been consistent across the past two cycles.
What is the current share price?
As of recent trading, Vibrant Group shares changed hands at 0.138 SGD, according to Tiger Brokers data. The previous session closed at 0.142 SGD, with intraday movement between 0.14 and 0.142 SGD. TradingView recorded the price at 0.16 SGD as of late November 2025, and Stockopedia showed SG$0.14 on April 27, 2026 — the variation reflects different data-update timestamps across platforms.
Live price updates
The stock trades on the Singapore Exchange under ticker BIP.SI. Volume has been relatively thin, with individual sessions reporting anywhere from 53,000 to low-millions of shares. The 52-week high of 0.22 SGD was set on July 28, 2025, per StockAnalysis data, while the 52-week low of 0.0490 SGD establishes the range’s lower bound.
Recent trading volume
Fintel recorded a market capitalization of 108.86 million SGD as of November 27, 2025, alongside a 1-year price change of 213.73%. The shares are currently trading 64.07% above their 200-day moving average, according to Stockopedia — a technical signal that typically attracts momentum-focused traders but also raises questions about near-term pullback risk.
What is the Vibrant Group share price history?
The stock has staged a dramatic recovery. One year ago, shares hovered in the 0.05 SGD range; they now command 0.14–0.16 SGD depending on the data source. The 52-week range spans from 0.0490 to 0.22 SGD, and the stock fell 4.60% in the week prior to one tracked period, per TradingView.
52-week range
The 52-week high of 0.22 SGD was recorded on July 28, 2025. The low of 0.0490 SGD occurred earlier in the tracking period. Moomoo reported a 52-week high of 0.210 SGD with a share price of 0.144 SGD and volume of 53,000 shares — figures that track closely with StockAnalysis data.
A 213% annual gain is exceptional for a freight-and-logistics stock trading at sub-0.20 SGD. Investors who bought near the 52-week low would have seen their position more than quadruple — but late entrants face a much higher entry cost relative to recent history.
Historical charts
The price trajectory shows sharp movement concentrated in mid-to-late 2025, coinciding with the period when the stock crossed above 0.20 SGD briefly before retreating. The low beta of 0.28, per Fintel data, suggests the stock has been less volatile than the broader market despite the large percentage moves — indicating the absolute price movements remain small in Singapore-dollar terms.
What is the Vibrant Group share price target?
Public analyst price targets for Vibrant Group are not readily available in the research data. The company’s P/E ratio of 7.2x compares favorably to the sector average of 13.4x, per Investing.com, suggesting the stock may be undervalued relative to transportation-sector peers. However, without broker coverage, investors must rely on their own valuation analysis.
Analyst forecasts
No Tier 1 or Tier 2 analyst coverage is reflected in the available data sources. This is typical for smaller-cap SGX stocks where research coverage from major brokerages is limited. Investors seeking price targets would need to model expected earnings, compare against peer multiples, or monitor institutional activity through filings.
Buy signals
The technical picture shows the stock trading well above its 200-day moving average, a signal that momentum traders often interpret as bullish. However, the elevated position relative to moving averages can also signal mean-reversion risk. Value-conscious investors may note that the P/E of 7.68, per StockAnalysis, sits below both the sector average and the broader market’s typical multiple.
Value investors see a sub-8x P/E that looks cheap on paper. Momentum traders see an elevated price relative to moving averages as a warning flag. Both signals cannot be right simultaneously, and without analyst support, the burden of valuation falls entirely on the individual investor.
Who is the Vibrant Group CEO?
The research data references Eric Khua in connection with Vibrant Group, appearing in annual report contexts. The leadership team shapes dividend policy, capital allocation, and the company’s trajectory in the freight-and-logistics sector — particularly relevant given the stock’s sharp price appreciation and consistent annual payouts.
Eric Khua profile
Eric Khua’s specific tenure length, prior experience, and strategic priorities would require review of Vibrant Group’s official filings or annual reports, which were not available in the current dataset. The absence of detailed public profiles for small-cap CEOs is common in Singapore’s exchange environment.
Leadership changes
No recent leadership transitions were identified in the research materials. For investors prioritizing governance stability, this continuity may be viewed positively — or, depending on performance, may raise questions about board refreshment.
Price and dividend timeline
Key financial milestones and pricing events for Vibrant Group across the tracked period:
| Date | Event | Source |
|---|---|---|
| Sep 7, 2023 | Ex-dividend date, 0.001 SGD payout | StockAnalysis |
| Sep 6, 2024 | Ex-dividend date, 0.002 SGD payout | StockAnalysis |
| May 23, 2025 | Stock closed at 0.0800 SGD | StockAnalysis |
| Jun 27, 2025 | Anticipated earnings date | StockAnalysis |
| Nov 26, 2025 | Share price 0.16 SGD | Fintel |
| Nov 27, 2025 | Market cap 108.86M SGD | Fintel |
| Sep 9, 2025 (projected) | Next ex-dividend date | Fintel |
What we know — and what we don’t
Confirmed
- Dividend paid 0.002 SGD on Sep 6, 2024 ex-date
- EPS TTM 0.01 SGD across multiple sources
- Market cap 54.43M SGD as of May 2025
- P/E ratio 7.68, shares outstanding 680.35M
- Price climbed from 0.08 SGD in May 2025 to 0.14+ SGD recently
- 1-year change approximately 213%
Unclear
- Yield reported differently (2.41%–4.82%) across platforms
- No Tier 1 source confirmation of financials
- No publicly available analyst price targets
- Limited 2025-2026 forward guidance
- CEO profile and governance details not publicly available
What the data providers say
Vibrant Group has an annual dividend of 0.002 SGD per share, with a yield of 2.47%.
— StockAnalysis (Financial Data Provider)
Dividend yield was 4.82% in 2024, and payout ratio reached 35.40%.
— TradingView (Charting Platform)
The share price of Vibrant Group Limited as of 26 November 2025 is $0.16 / share.
— Fintel (Financial Analytics)
Related reading: Pure Gold Price Singapore
Vibrant Group’s impressive 213% gain aligns with trends among SGX peers, where the DBS share price underscores banking sector stability and yields.
Frequently asked questions
Does Vibrant Group pay dividends?
Yes. Vibrant Group pays an annual dividend, with the most recent confirmed payout of 0.002 SGD per share on an ex-dividend date of September 6, 2024.
What is the current Vibrant Group share price?
The most recent price tracked was 0.138 SGD, according to Tiger Brokers data, with the previous session closing at 0.142 SGD.
What is the Vibrant Group share price history?
The stock traded as low as 0.0490 SGD over the past 52 weeks and reached a high of 0.22 SGD on July 28, 2025. Over the past year, the price has gained approximately 213%.
Is Vibrant Group a good stock to buy?
The stock’s P/E of 7.2x sits well below the sector average of 13.4x, suggesting potential undervaluation — but the absence of analyst coverage and the stock’s elevated position relative to moving averages introduce risk. Investors should conduct their own due diligence.
What is the dividend yield for Vibrant Group?
Reported yields vary across platforms, clustering between 2.41% and 2.9% currently, with TradingView reporting 4.82% in 2024 when the stock traded at lower prices.
Where does Vibrant Group trade?
Vibrant Group trades on the Singapore Exchange (SGX) under the ticker symbol BIP.SI.
What is the 52-week high for Vibrant Group shares?
The 52-week high is 0.22 SGD, recorded on July 28, 2025, according to StockAnalysis data.
More related posts
 Citadine Raffle Place Singapore: Serviced Apartment Guide
 7-11 Printing Service Singapore: How to Print at 7-Eleven
 Badminton India Open 2026: Venue, Tickets, Schedule, Winners
 33,000 Yen to SGD: Live Rate, Fees & Best Conversion
 How to Start a Garden: Step-by-Step Beginner Guide
 Be t Digital Marketing Agency: How to Choo e in 2025
 Hardware Shop Near Me – Quick Finder Guide
 Coin Master Free Spins: Official Daily Links & Guide